In order to obtain good sequencing results, you MUST examine your sequencing chromatogram. If you are using just the text data, you could be publishing data that is completely invalid! This page explains how to interpret a DNA sequencing chromatogram.
Interpretation of Sequencing Chromatograms
Automated DNA Sequencers generate a four-color chromatogram showing the results of the sequencing run, as well as a computer program's best guess at interpreting that data --- a text file of sequence data. That computer program, however, does make mistakes and it is the client’s responsibility to manually double-check the interpretation of the primary data. Predictable errors occur near the beginning and again at the end of any sequencing run. Other errors can show up in the middle, invalidating individual base calls or entire swaths of data. This document explains how to examine the normal DNA sequencing chromatogram, describing common issues and how to interpret them.
STEP I -- Get a General Sence of How Clean the Sequence Is
- How clear are the nucleotide peaks, in general?
You should see evenly-spaced peaks, each with only one color. Peak heights may vary 3-fold, which is normal. 'Noise' (baseline) peaks may be present, but with good template and primer they will be quite minimal.
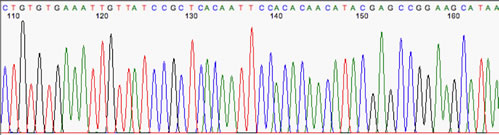
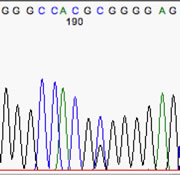
Here's an example of an excellent sequence: Note the evenly-spaced peaks and the lack of baseline 'noise'
The example below has a little baseline noise, but the 'real' peaks are still easy to call, so there's no problem with this sample:
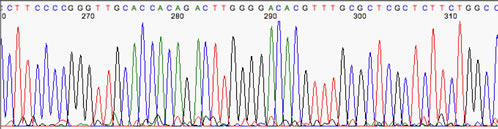
Now we have an example that has too much baseline noise. Note the multicolored peaks at 271, 273, 279, and the oddly-spaced interstitial peaks near 291 & 301. Also, it is impossible to determine the real nucleotide is at 310.
STEP II - Check for Mis-Called Nucleotides
- Are there obvious errors in the basecalling?
Sometimes the computer will mis-call a nucleotide when a human would have identified a different nucleotide. Most often, this occurs when the basecaller calls a specific nucleotide, when the peak really was ambiguous and should have been called as 'N'. Occasionally, the computer will call an 'N' when a human would be confident in making a more specific basecall. Such mis-calls can occur even in the most error-free regions of the gel. Quickly scan the gel for extremely small peaks, 'N' calls, and any mis-spaced peaks or nucleotides.
- Mis-spaced peaks:
One good way to detect artifacts or errors in a sequencing chromatogram is to scan through it, looking for mis-spaced peaks. At the same time, watch for mis-spaced letters in the text sequence along the top. Nucleotides that have been erroneously inserted into a sequence will often appear to be oddly spaced relative to their neighboring bases, often too close.
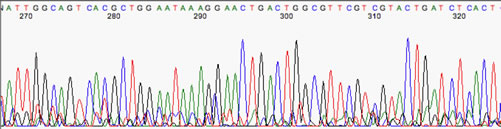
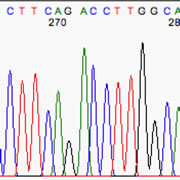
Some sequencers have predictable errors in base spacing. A common one is a G-A dinucleotide, which leaves a little extra space between them. Often, it is ignored by the basecaller, as in this example at right:
**Note the extra space between the letters G and A (nt's 271 and 272) corresponding to the mis-spaced peaks just below them. No harm done, in this case; the sequence is fine.
Sometimes, however, those spaces are mis-interpreted as missing nucleotides. In the example at right, note the 'N' called in the space between the G-A pair. That is an erroneous call; there is no missing base 'N' at that position.
**You can spot this by scanning the text sequence at the top of the window, looking for oddly-spaced letters. Of course, you may also spot this simply by looking for 'N' nucleotides.
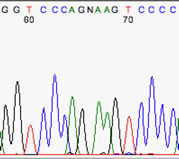
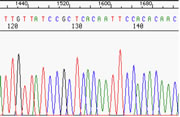
The real problem comes when the basecaller attempts to interpret a gap as a real nucleotide, such as in the example at right. The typical scenario is a sequence with noticeable baseline noise, and a gap is called as if the baseline noise were a real peak. Often it's those aforementioned G-A gaps, but not necessarily, as the example here shows.
**Note the real T peak (nt 58) and the real C peak (nt 60), with the G barely visible between them. Despite its size, the baseline-noise G peak was picked as if it were real. The clues to spot are (i) the oddly-spaced letters, with the G squeezed in, and (ii) the gap in the 'real' peaks, containing a low noise peak.
This is a great example of why a weak sample, with its consequent noisy chromatogram, is untrustworthy.
- Heterozygous (double) peaks:
A single peak position within a trace may have but two peaks of different colors instead of just one. This is common when sequencing a PCR product derived from diploid genomic DNA, where polymorphic positions will show both nucleotides simultaneously. **Note that the basecaller may list that base position as an 'N', or it may simply call the larger of the two peaks.
Realize, too, that it's easy for a human to miss these. If you want to be sure you've detected all of the polymorphic positions, you should be using a computer program to scan your chromatograms!
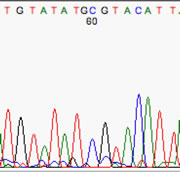
Here is a great example of a PCR amplicon from genomic DNA, with a clear heterozygous single-nucleotide polymorphism (SNP). In this case, one allele carries a C, while the other has a T. Both peaks are present, but at roughly half the height they would show if they were homozygous.
**Note that the peak was called an 'N' by the basecaller. A comparison of text sequences would probably notify you of the presence of a SNP at this particular location.
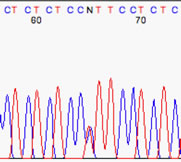
At right is a heterozygote that was missed by the basecaller. The text sequence simply shows a 'C'. If all of your other sequences also had a 'C' here, you would never realize that you had a het SNP ... unless you scanned your chromatograms.
In fact, it can be difficult to go through reams of sequencing chromatograms, looking for heterozygote peaks like this. It's fine for small projects --- just look for the nested multicolor peak. For big SNP-detection projects, though, you should be using a computer program that can detect these for you (i.e. such as Sequencher by GeneCodes, Inc.).
STEP III - Loss of Resolution Later in the Gel
Even normal chromatograms stop providing accurate data after some distance along sequence:
As the gel progresses, it loses resolution. This is normal; peaks broaden and shift, making it harder to make them out and call the bases accurately. The sequencer will continue attempting to "read" this data, but errors become more and more frequent.
Below are three snapshots representing data from progressively later regions in a normal chromatogram:
 |
This is a typical example of data from a very good sample analyzed by an ABI3130xl DNA Analyzer. In this case, it is pGEM3 DNA sequenced with the T7 primer. **This is a prime, high-quality portion of the sequence. Note the crisp, clean bands, well-separated and with no ambiguity as to the proper basecall. You could easily call this sequence manually. |
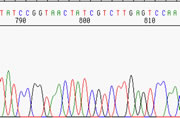 |
If you scroll the above chromatogram further to the right (to higher-numbered nucleotides), you see the frame depicted at left. It is evident that, here at 800 nucleotides, the sequence is still quite reliable. The peaks are broader and clearly less well-resolved, but there still is evident separation between them, and basecalls can still be made accurately. **Note that the spacing between the basecall letters at top is regular, which is often a good indication of the reliability of the data. When that spacing becomes irregular, be careful! |
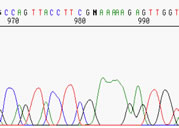 |
Here, you are out at the very limit of resolution, around 900-1000 nt. You get only a general sense of the sequence here. There are only a few basecalls that can be considered reliable. The G at 981 may in fact be two G's, the N could be a G or an A, and who knows how many A's there are afterwards. **If you aligned the sequence with a known pGEM sequence, you might discover that it is correct, so this is what we sometimes call "useable" data, but certainly not accurate data. |
General take-home conclusions: Late in the chromatogram, watch for multiple bases of any one nucleotide where there really should be only one. Watch, too, for wide peaks mis-counted by the program as two nucleotides, when it should have been just one nucleotide. Wide peaks may also obscure smaller adjacent peaks (no example shown here).